Tour

Platform Tour

Each functional display is designed to show the key information at a glance and to be easy to use, not to bury you in detail.

Request the working demo Book a walkthrough

Screen 1 of 12

Site & fleet overview

One page for the level you are looking at: a whole site or fleet, or a single facility or platform. The answer comes first, in plain words, with indicators only for findings and a shared measure counted once.
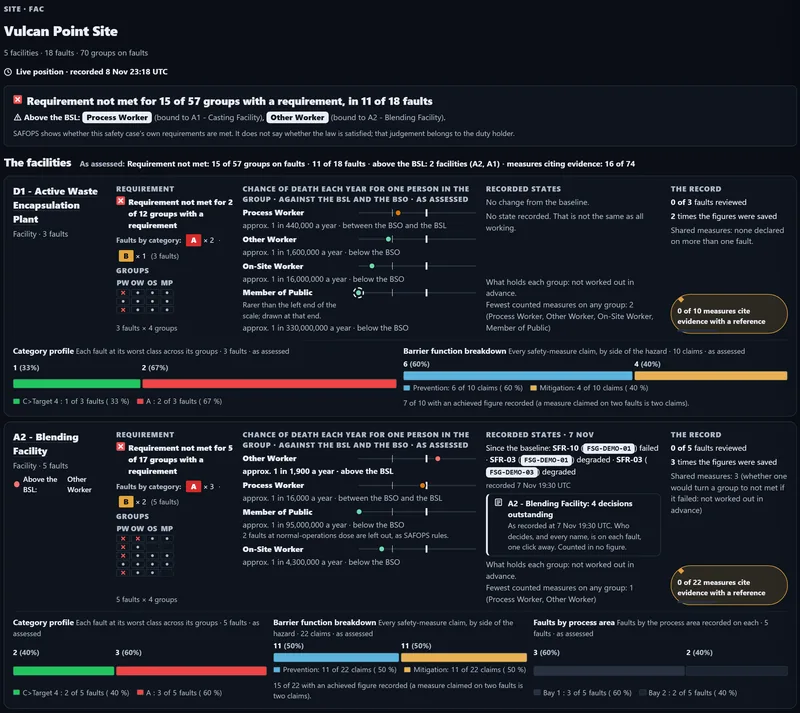
The management overview: every facility on one page.
The management overview: every facility on one page. Demonstration data.

Screen 2 of 12

Fault register

Every fault in the project, by title. We open one: a glove tears while powder is being handled in a glovebox.
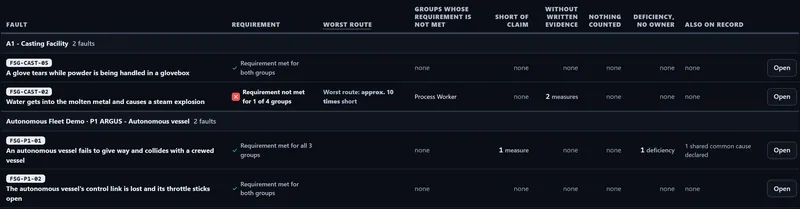
Choose a fault.
Choose a fault. Demonstration data.

Screen 3 of 12

Root causes & controls

Glove inspection, blunt tools and negative pressure act before a tear ever starts. The CAUSES page shows them without crowding the bow-tie.
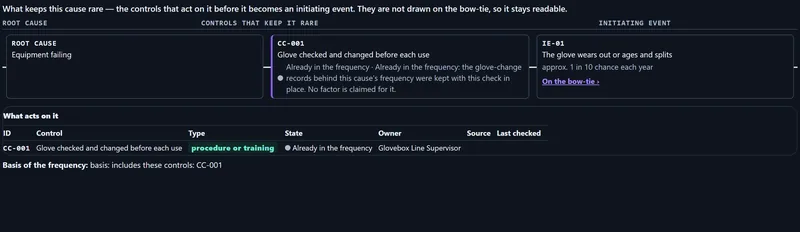
What keeps a cause in check: the glove inspection, already counted in the cause's frequency.
What keeps a cause in check: the glove inspection, already counted in the cause's frequency. Demonstration data.

Screen 4 of 12

Bow-tie model

What can cause it, what acts before and after the hazard, and who it can reach.
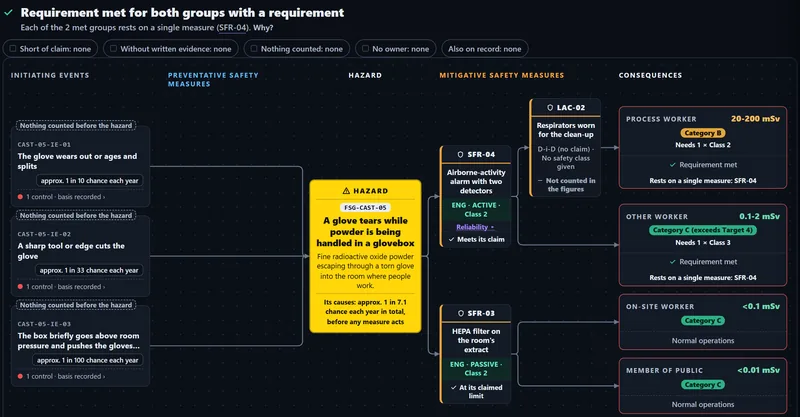
A glove tears while powder is being handled in a glovebox: the bow-tie comes first, every measure and every group with its answer.
A glove tears while powder is being handled in a glovebox: the bow-tie comes first, every measure and every group with its answer. Demonstration data.

Screen 5 of 12

Barrier reliability

Two detectors voting 1oo2, calculated from their declared figures and shown beside the figure the case claims.
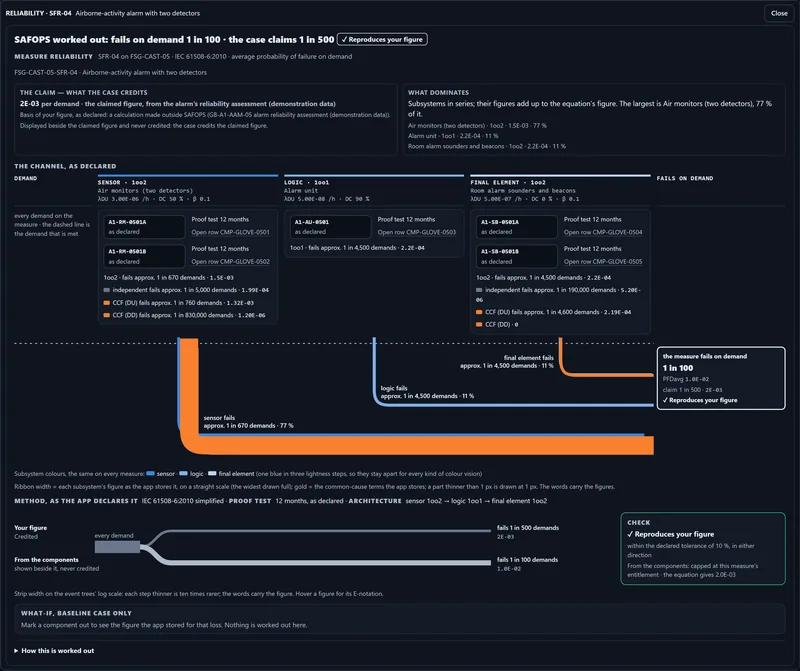
The reliability of the airborne-activity alarm calculated from its declared components.
The reliability of the airborne-activity alarm calculated from its declared components. Demonstration data.

Screen 6 of 12

Barrier states

One detector of the airborne-activity alarm has been recorded out. SAFOPS recalculates the figures and labels the result “Live position · recorded time”. The Baseline case stays as it was assessed.
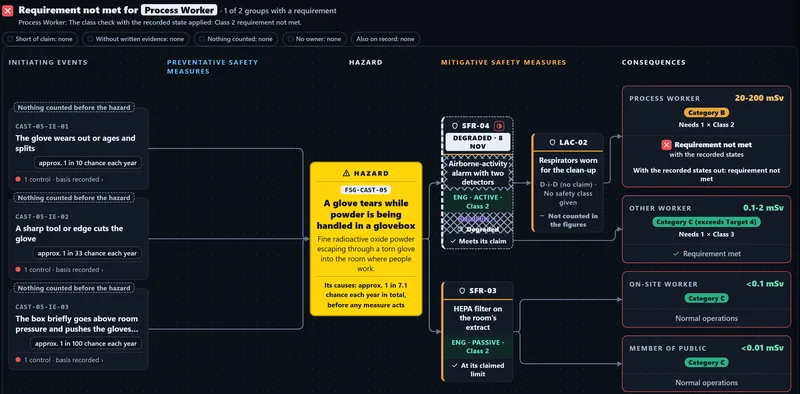
The Live position, calculated from recorded states.
The Live position, calculated from recorded states. Demonstration data.

Screen 7 of 12

Event tree

Every fault has its event tree: one ribbon per route, narrowing at each measure in turn. The figures in the drawing always agree with SAFOPS’s own table.

The event tree for a glove tearing in a glovebox: each route, and the risk at its end.
The event tree for a glove tearing in a glovebox: each route, and the risk at its end. Demonstration data.

Screen 8 of 12

What-if analysis

Take one measure out and watch the requirement answer again. A what-if only: nothing is recorded or saved.
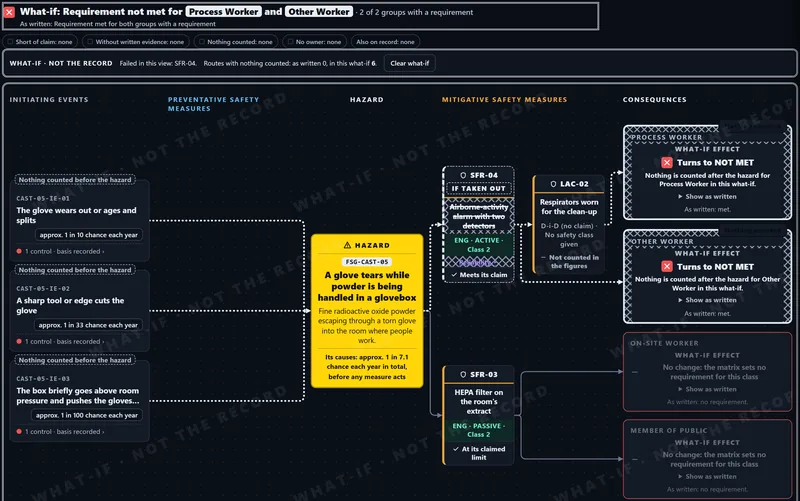
Take one measure out and see the effect.
Take one measure out and see the effect. Demonstration data.

Screen 9 of 12

Risk matrices

Every project starts from a template you can read and adjust: its own groups of people, its own bands for likelihood and severity, and its own risk matrix.
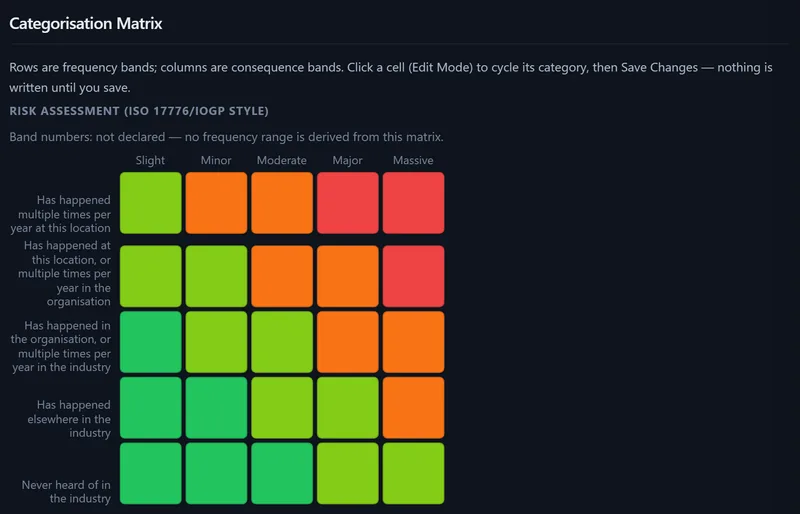
Each cell holds one of the project's categories: Low, Medium, High or Very High. Click a cell to change it; nothing is written until you save.
Each cell holds one of the project's categories: Low, Medium, High or Very High. Click a cell to change it; nothing is written until you save. Demonstration data.

Screen 10 of 12

Industry frameworks

The same bow-tie works in any sector: each case is assessed against its own standard’s risk matrix.
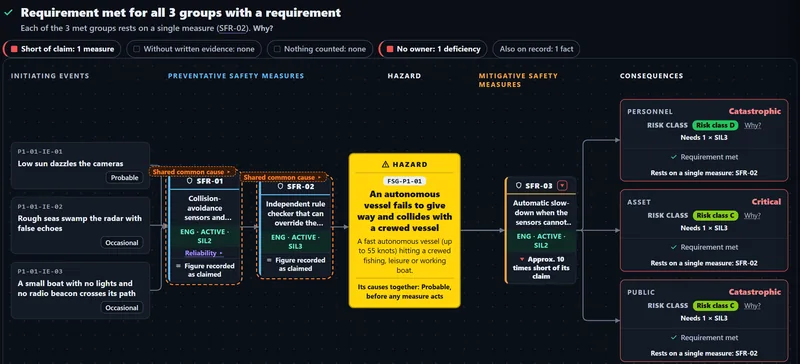
An autonomous vessel fails to give way and collides with a crewed vessel: the same screen for a defence case on the Def Stan matrix.
Demonstration data.

Screen 11 of 12

Shared measures

One measure can protect several faults. SAFOPS counts it once, and the COMMON CAUSE page lists the measures one cause could take out together.
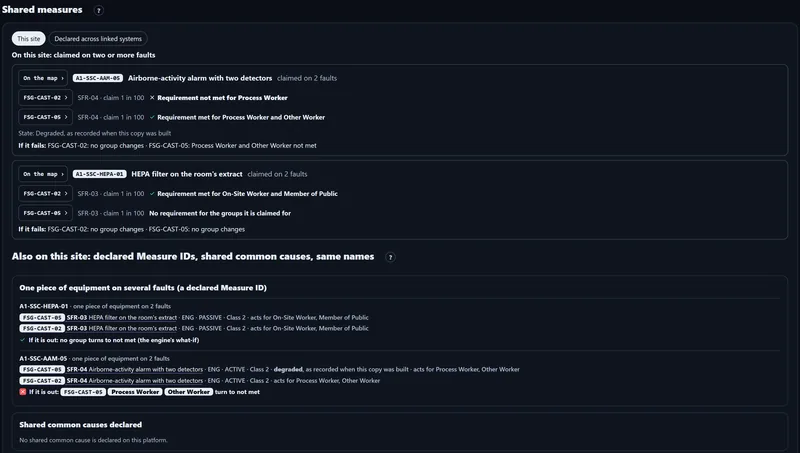
One measure, declared once, claimed on two faults: the HEPA extract and the alarm on the glove tear and the steam explosion.
One measure, declared once, claimed on two faults: the HEPA extract and the alarm on the glove tear and the steam explosion. Demonstration data.

Screen 12 of 12

Time Machine

The case as it stood at a chosen time, calculated with today’s rules.
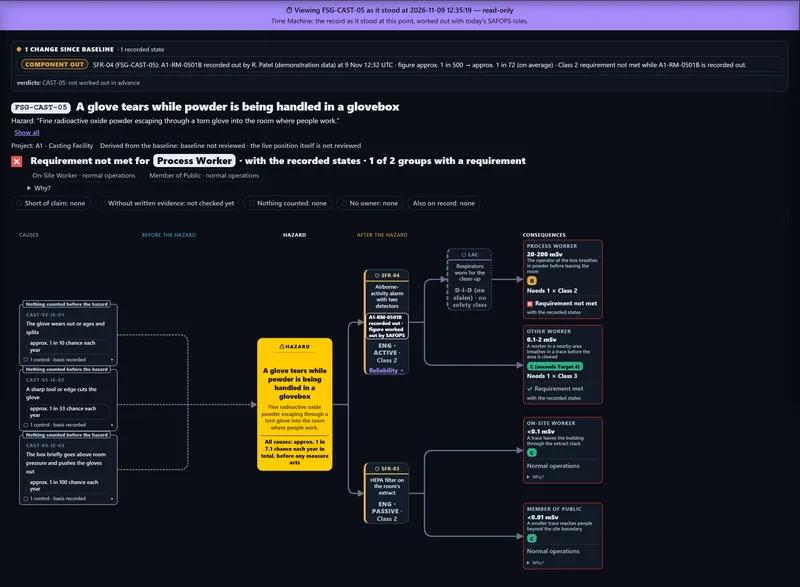
The case as it stood at a chosen time, calculated with today's rules.
The case as it stood at a chosen time, calculated with today's rules. Demonstration data.

Demonstration data. Nothing on this page is an issued safety case.

Ready to build your first Living Safety Case?

Request the working demo Book a walkthrough