See the Route the Risk Takes
Behind every residual figure is an event tree: a cause, then each measure in turn holding or failing. SAFOPS draws it for every fault as a ribbon: the wider the route, the more often it happens.
One Tree per Set of Causes
Each fault’s causes are grouped into sets, and each set gets its own event tree. Ribbon widths are the branch frequencies, on one log scale per fault. Each gate is a measure: hold, or fail. The red edge marks the route where every measure fails.
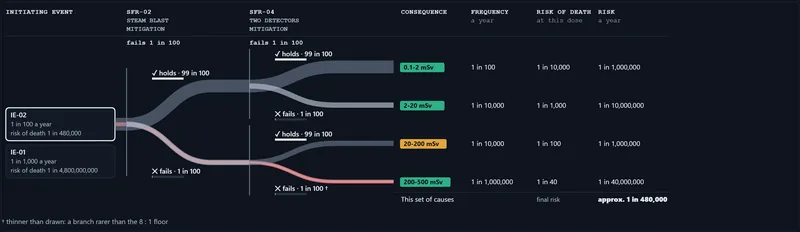
The Drawing and the Numbers Always Agree
Every figure in the drawing is checked against SAFOPS’s own table each time the page opens. Prefer numbers? The table is one click below the drawing, one tree at a time or all together.
With the Recorded States
When states are recorded, the trees are run again with them. A failed or out measure counts as failing every time, and a degraded measure uses its degraded figure.